What Measurement Uncertainty Actually Means
A measurement is not simply a number. It is an estimate of a defined quantity, supported by a method and accompanied by uncertainty. A temperature reading, for example, depends on the sensor, its placement, surrounding conditions, and when the reading is taken. Measurement uncertainty describes the dispersion of values that could reasonably be attributed to the quantity being measured.
Uncertainty is different from measurement error. Error is the difference between a measured value and a reference value; the exact error is often unknown because the true value is not perfectly known. Uncertainty expresses the limits of what the measurement process tells us. It is not evidence that someone made a mistake, and it is not necessarily a guaranteed maximum error.
Start by defining the measurand: the specific quantity you intend to measure. “Room temperature” is vague; “air temperature at desk height, away from direct sunlight, averaged over five minutes” is more useful. A poorly defined quantity can create ambiguity that no extra decimal places will resolve.
Precision, Accuracy, and Resolution Are Different
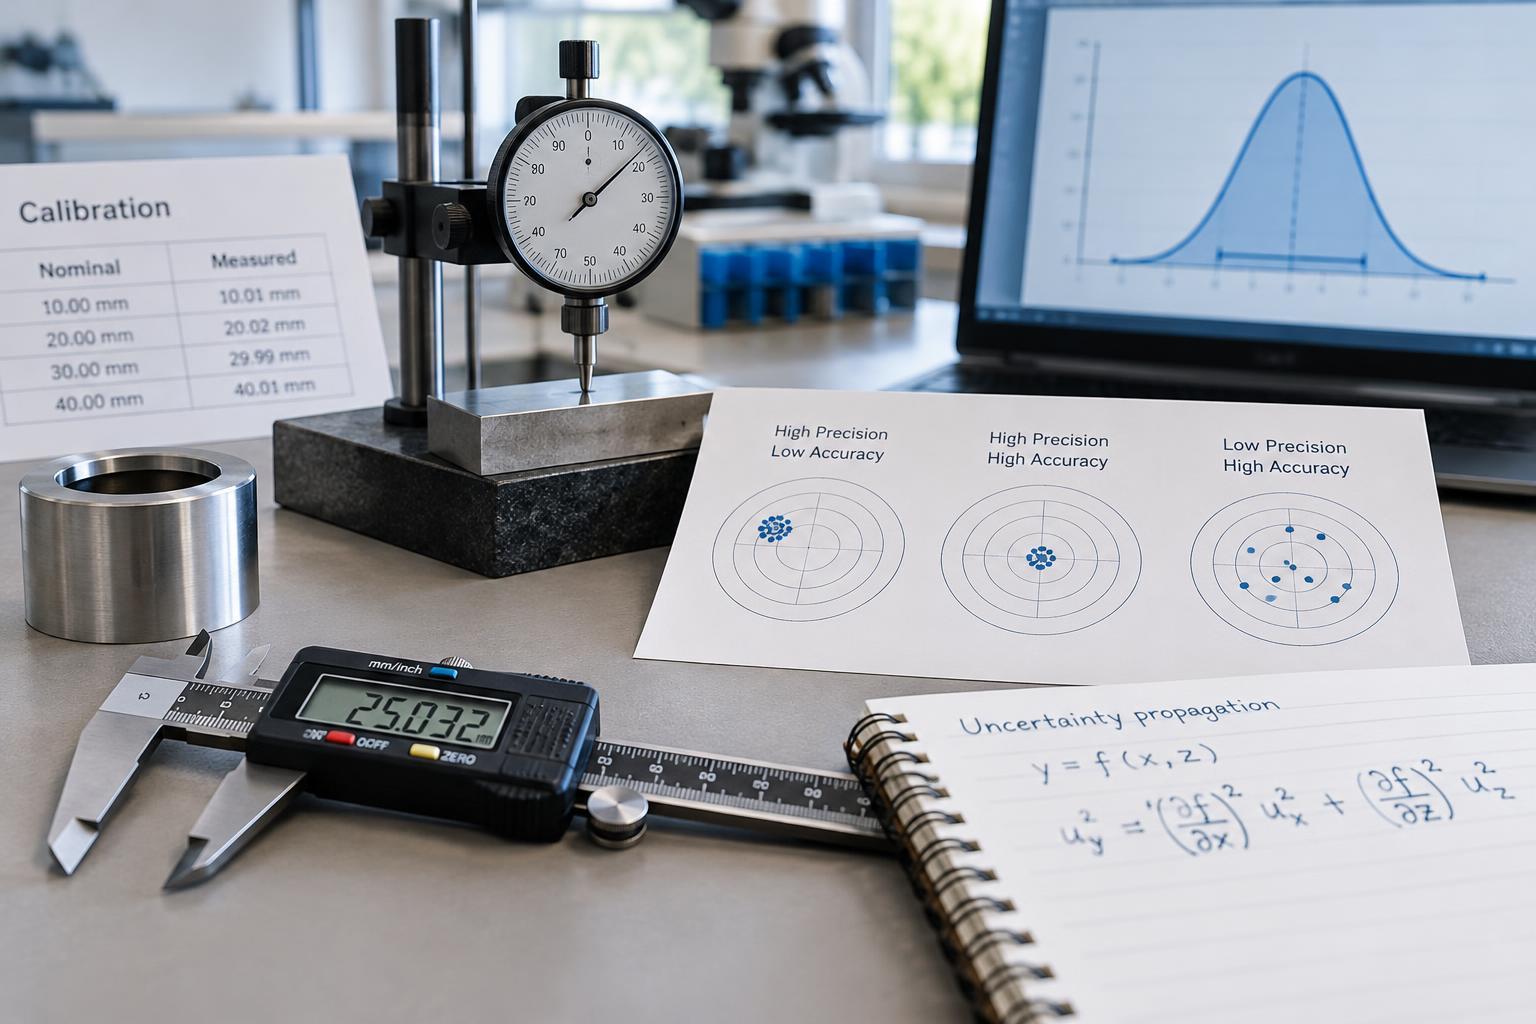
Precision concerns agreement among repeated measurements under stated conditions. A scale that repeatedly displays nearly the same mass is precise under those conditions. Repeatability describes precision when the method, equipment, operator, location, and time interval remain closely controlled. Results may vary more when operators, instruments, or laboratories change.
Accuracy concerns agreement with the true value, usually assessed in practice using suitable reference values. An instrument can be precise but inaccurate: a scale with a persistent offset may give tightly clustered readings that are consistently too high. Accuracy is a qualitative concept, although equipment specifications often use the word as shorthand for numerical performance limits.
Resolution is the smallest change an instrument can display or distinguish. A thermometer showing hundredths of a degree is not automatically accurate to that level. Random variation may be reduced by averaging independent readings from a stable process, but averaging does not remove a persistent bias. Correcting known biases and accounting for uncertainty in those corrections are separate tasks.
What Calibration Does—and Does Not—Establish
Calibration establishes a relationship between an instrument’s indications and values supplied by measurement standards, including the uncertainties involved. It can reveal an offset, a scale-factor difference, or behavior that changes across the measurement range. Calibration is not the same as adjustment: discovering that an instrument reads high does not necessarily mean someone has changed its settings.
Metrological traceability means a measurement result can be related to a stated reference through a documented, unbroken chain of calibrations, each contributing uncertainty. Traceability supports meaningful comparison, but it does not guarantee that the uncertainty is small enough for a particular task. A traceable instrument can still be unsuitable for the required tolerance.
Calibration also does not eliminate effects introduced during use. Temperature, drift, vibration, sample handling, and operator technique may matter. A practical uncertainty budget lists relevant contributions, their estimated sizes, and how they affect the result. Some estimates come from repeated observations; others come from certificates, specifications, resolution limits, or established knowledge of the method.
How Uncertainty Propagates Through Calculations
When measured values feed a calculation, their uncertainties affect the output. Propagation depends on both the input uncertainties and the sensitivity of the calculation to each input. Standard uncertainty expresses an uncertainty contribution in standard-deviation form, providing a common basis for combining contributions from different sources.
For independent inputs, a first-order approximation combines squared standard uncertainties after weighting them by the appropriate sensitivity factors. For a sum or difference, this often becomes the square root of the sum of squared absolute uncertainties. For a product or ratio, the corresponding relative standard uncertainties combine in quadrature, provided the approximation is suitable.
Consider a rectangle with length 2.00 m and width 3.00 m, with independent standard uncertainties of 0.01 m and 0.02 m. Its area is 6.00 m². The uncertainty contributions are 3.00 × 0.01 = 0.03 m² and 2.00 × 0.02 = 0.04 m². Combining them gives an area standard uncertainty of 0.05 m².
Independence matters. Measurements sharing a calibration reference or environmental influence may be correlated, so covariance terms must also be considered. Strongly nonlinear calculations or large uncertainties may require a more detailed approach, such as Monte Carlo propagation, rather than a simple first-order formula.
How to Report and Interpret a Result
Report the value, unit, uncertainty, and what that uncertainty represents. For the rectangle, write: “Area: 6.00 m²; combined standard uncertainty: 0.05 m².” If using a ± notation, label it clearly. Otherwise, readers may mistake a standard uncertainty for a guaranteed interval or a stated coverage interval.
Expanded uncertainty multiplies the combined standard uncertainty by a coverage factor, k. Under suitable assumptions, including an approximately normal output distribution and adequate degrees of freedom, k = 2 gives roughly 95% coverage. That interpretation is not automatic. State the factor used, round uncertainty sensibly, and align the result’s decimal place with it. Good reporting makes the measurement’s limitations visible rather than hiding them behind numerical detail.