Why Matter Leaves Patterns in Light
Spectroscopy studies how matter interacts with electromagnetic radiation. Instead of measuring only the total amount of light, a spectrometer separates a signal by wavelength, frequency, or photon energy. The resulting spectrum shows where light is absorbed, emitted, or otherwise changed. Those patterns can help identify a substance and reveal information about its surroundings.
The underlying principle is that atoms and molecules have allowed energy states. An atom can absorb a photon when its energy matches an allowed transition to a higher state. A transition to a lower state can release energy as a photon. Molecules also have vibrational and rotational states, adding more possibilities. Because different structures have different energy spacings, their spectra can serve as characteristic fingerprints. Shorter-wavelength photons carry more energy than longer-wavelength photons.
Absorption Spectra: Finding the Missing Light
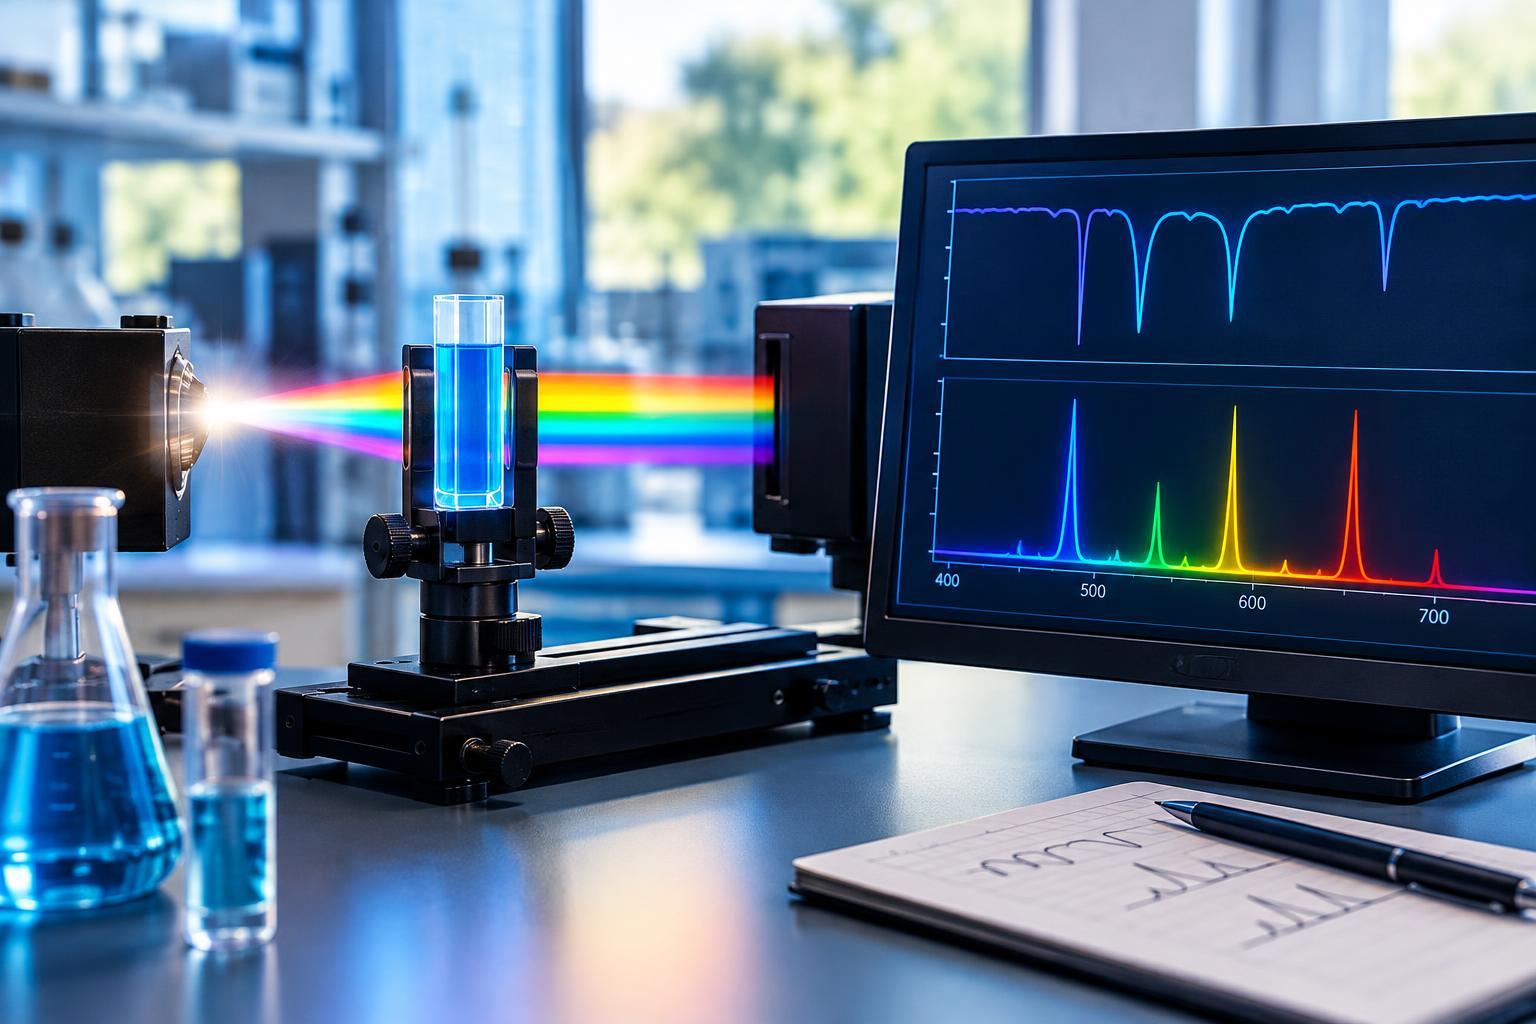
In a typical absorption measurement, light passes through a sample before reaching a detector. The instrument compares the transmitted light with a reference measurement. Wavelengths absorbed by the sample become weaker, creating a pattern that reflects its energy transitions. A useful light source must provide radiation across the wavelength range being examined.
The graph’s vertical axis matters. In a transmission spectrum, absorption features appear as dips because less light gets through. In an absorbance spectrum, the same features appear as upward peaks. Absorbance is calculated from the ratio of reference to transmitted intensity using a logarithm. Before interpreting any peak or valley, check which quantity is plotted.
For example, infrared absorption can reveal vibrations associated with particular chemical bonds. A broad feature may suggest an O–H group, but its shape and position depend on the molecular environment. Identifying a molecule usually requires examining several features together, especially the complex pattern often called the fingerprint region.
Emission Spectra: Reading the Light Matter Produces
Emission spectroscopy measures light produced after matter has been energized. Heat, electrical discharges, or absorbed light can populate excited states. As the system relaxes, some transitions release photons. A spectrometer records their wavelengths and intensities, producing bright lines or broader bands against a background.
Low-density atomic gases often produce distinct emission lines. Sodium, for instance, has a familiar pair of closely spaced yellow lines that may look like one feature on an instrument with insufficient resolution. Observing a consistent set of lines is stronger evidence for an element than matching a single bright peak.
Molecular emission can be broader and more complicated. In fluorescence, some absorbed energy is commonly lost through nonradiative processes before a photon is emitted. The emitted light therefore often has a longer wavelength than the excitation light. Absorption and emission spectra are related through energy levels, but they should not be assumed to be identical.
A Practical Way to Read a Spectrum
Start with the axes and units. Visible-light spectra commonly use wavelength in nanometers, while infrared spectra often use wavenumber in inverse centimeters. Wavenumber is proportional to photon energy, and an infrared plot may run from larger to smaller values from left to right. The vertical axis might show absorbance, transmission, detector counts, or normalized intensity.
Next, examine the baseline and distinguish broad bands from narrow lines. Compare several feature positions with suitable reference spectra, checking whether expected companion features are present. Consider whether the reference and sample were measured under comparable conditions. A gas-phase spectrum may differ substantially from that of the same substance in solution.
Finally, look for reasons to distrust an apparent match: excessive noise, detector saturation, overlapping features, or inadequate spectral resolution. A missing line is not necessarily decisive if the instrument could not detect it. Likewise, a small spike is not convincing evidence unless it is reproducible and distinguishable from noise.
What Spectra Reveal—and Where Their Limits Begin
Feature positions primarily help identify transitions, while intensities and shapes can provide additional information. Under suitable conditions, absorbance increases with concentration and the distance light travels through a sample, as described by the Beer–Lambert relationship. Quantitative measurements still require appropriate calibration and control of interference, scattering, and instrumental limitations.
Line widths and relative intensities can also carry clues about temperature, pressure, and interactions with surrounding particles. However, the instrument itself broadens features, and mixtures can contain overlapping signals. Reliable interpretation separates these effects rather than assigning every change to the sample.
This is why spectroscopy is both powerful and context-dependent. It can reveal elements in a glowing gas, chemical groups in a material, or substances absorbing light along an astronomical line of sight. The strongest conclusions come from a coherent pattern of features, a suitable measurement method, and a clear account of uncertainty—not from one striking peak.