Biodiversity Is More Than a Species Count
A meadow with many wildflower species might look more biodiverse than one dominated by a single grass. But biodiversity is not one property that scientists can capture with a universal score. It includes genetic variation within species, differences among species, and the variety of ecosystems across a landscape. Species-based measurements describe an important part of that picture, not the whole.
Before collecting data, researchers define what they want to measure. Are they comparing breeding birds in two woodlands, tracking insects after habitat restoration, or describing plant communities across a region? Each question requires a clear study area, a target group of organisms, and a relevant time window.
Scale also matters. One small plot may contain few species, while the surrounding landscape supports many because different habitats host different communities. Scientists therefore distinguish local diversity from regional diversity and examine how species composition changes between sites. Two places can have equal species counts yet contain entirely different organisms.
Species Richness: A Useful Count with Important Limits
Species richness is the number of species recorded within a defined sample or area. If a survey identifies 18 butterfly species, its observed richness is 18. This measure is straightforward to communicate and useful for comparisons when survey conditions are sufficiently consistent.
The key word is observed. A survey rarely finds every species present. Some organisms are uncommon, seasonal, difficult to identify, or active only under particular conditions. Observed richness usually increases as researchers search more locations, spend more time surveying, or collect more individuals. A longer species list can therefore reflect greater effort rather than a genuinely richer community.
Richness also says nothing about abundance or identity. A site with several widespread introduced species may have the same richness as one supporting vulnerable native specialists. Neither count alone establishes conservation value. Researchers often pair richness with information about species composition, habitat requirements, and ecological roles.
Evenness: How Individuals Are Distributed Among Species
Evenness describes how evenly individuals are distributed among the species recorded. Consider two hypothetical samples, each containing 100 individuals from four species. In the first, every species has 25 individuals. In the second, one species has 97 individuals and the remaining three have one each. Both samples have identical richness, but the first has much higher evenness.
Scientists often use diversity indices that combine information about richness and relative abundance. Shannon diversity responds to both the number of species and their abundance distribution. Simpson-based measures give relatively greater weight to common species. Several versions of Simpson’s index exist, with different numerical directions, so a reported value needs a clear definition.
These indices summarize community structure; they do not grade ecosystem health on their own. Naturally dominant species can produce low evenness in an otherwise functioning habitat. Abundance also requires care: counting individual birds is relatively straightforward, while separating individual plants that spread clonally can be difficult. For some communities, researchers use percentage cover or biomass instead of individual counts.
Sampling Design Shapes What Scientists Find
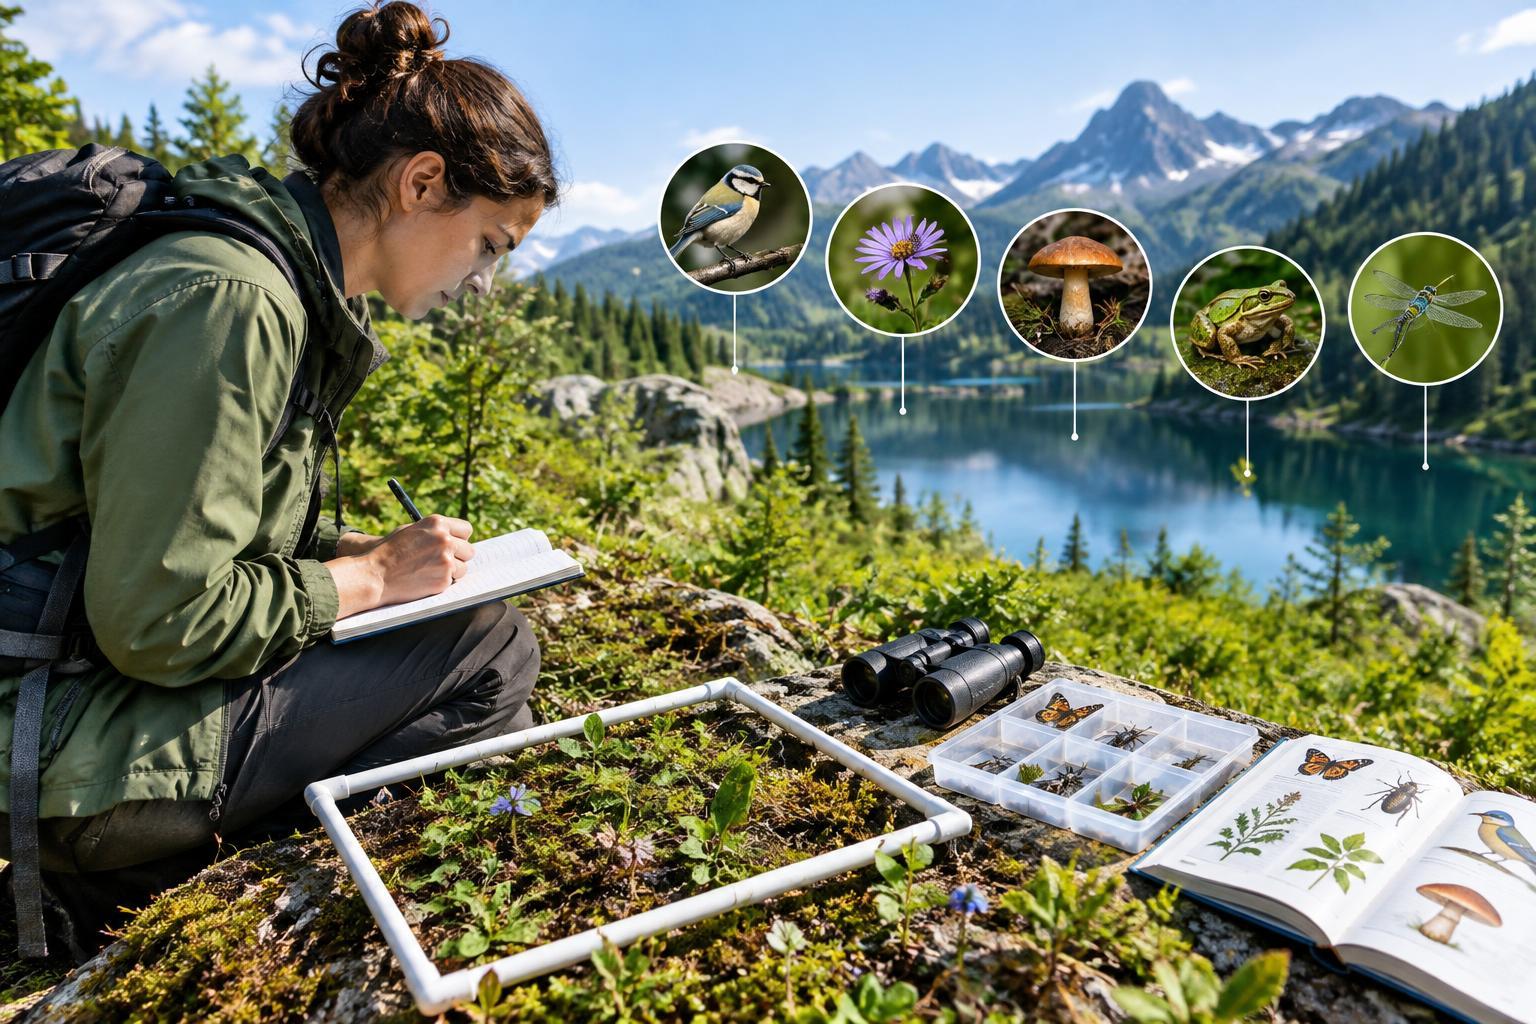
Different methods reveal different parts of a community. Quadrats can capture plants within small plots, camera traps can detect some terrestrial animals, and acoustic recorders can document species with recognizable calls. Environmental DNA can reveal genetic traces in water or soil, but those detections do not automatically provide reliable counts of living individuals.
Where and when sampling happens are equally important. Surveys restricted to paths may miss organisms in less accessible habitat. Sampling only during daylight overlooks many nocturnal species. Weather, season, equipment, and observer skill can all influence detection. Repeated visits help researchers distinguish inconsistent detection from genuine absence, and suitable statistical models can estimate detection probability.
Replication matters too. Many measurements taken inside one small patch do not necessarily represent independent evidence about a whole landscape. A stronger design samples multiple appropriate locations, uses consistent procedures, and records effort and environmental conditions. Random or stratified site selection can reduce the risk of surveying only convenient or unusually species-rich places.
Making Fair Comparisons and Interpreting Uncertainty
Before comparing sites, researchers check whether sampled areas, methods, seasons, and effort are comparable. Species accumulation curves show how recorded richness grows with additional sampling. A curve that continues rising suggests that further effort is likely to reveal more species, although a flattening curve does not prove that every species has been found.
Rarefaction can compare expected richness at a common number of sampled individuals or sampling units. Coverage-based approaches instead compare samples at similar estimated completeness. These tools help address unequal sampling, but they cannot fully repair mismatched methods, poor identification, or systematically overlooked habitats.
A useful biodiversity report therefore presents more than one headline number. It explains the sampling design, reports uncertainty, and considers richness alongside evenness and species composition. The strongest conclusion is not simply that one place is more diverse, but what differs, at which scale, and how confidently the evidence supports that interpretation.